- Monthly growth in core CPI eased substantially in June, marking two consecutive months of strong disinflation. Unlike in prior months, core services had a small contribution to overall inflation and most surprisingly, Owners’ Equivalent Rent (OER), the largest component of the CPI by weight, fell considerably. These otherwise “sticky” components are now the driving force behind disinflation. Increased volatility from month-to-month may now be a concern, but there is no clear way of addressing it.
Dramatic drop and increasing volatility
Annual growth in core CPI continues to ease at a relatively mild pace, falling to 3.2% in June from 3.4% in May. However, from month-to-month, disinflation in June was much more sudden with core CPI growing by only 0.06%, the smallest growth rate since January 2021.
June marks the second consecutive month of rapid cooling, and unlike in prior months this year, much of it was driven by core services components. When excluding shelter, core services contributed 0.02 percent points to overall CPI growth in June and -0.01 percent points in May, compared to an average contribution of 0.15 percent points in the first four months of 2024 (Chart 1). Core goods and energy prices remain in deflation territory, contributing -0.02 and -0.14 percent points respectively in June, while food prices are accelerated, contributing 0.03 percent points this month compared to 0.02 percent points in May.
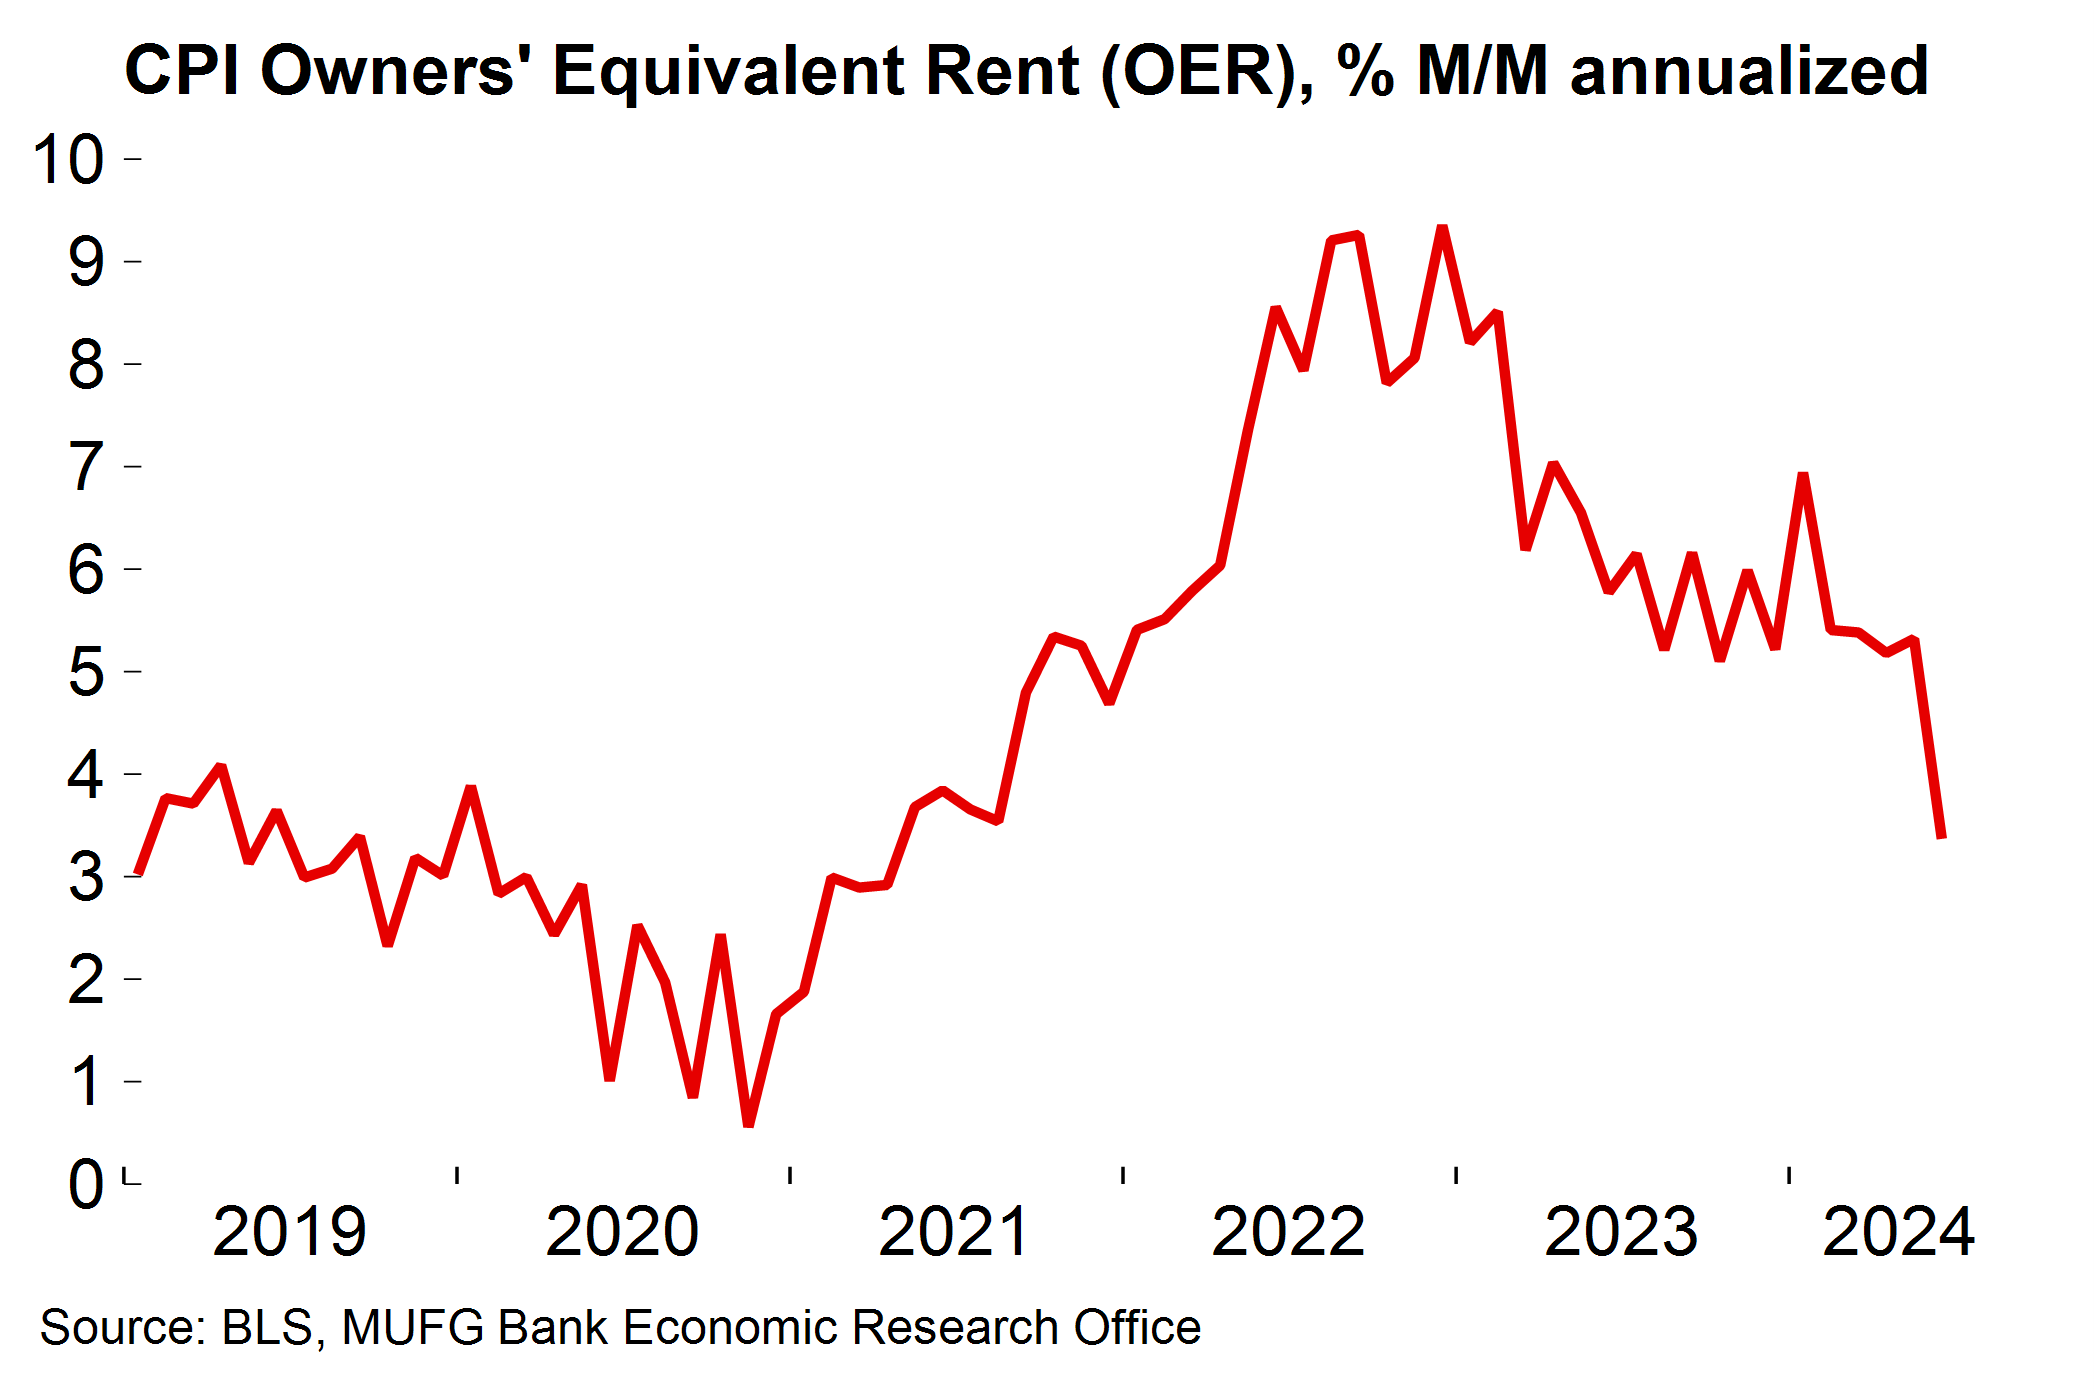
The most dramatic change in June was with shelter inflation, and more specifically, Owners’ Equivalent Rent (OER), the largest component of the CPI by weight. Shown in Chart 2, monthly annualized growth of OER fell dramatically to 3.4% in June from 5.3% in May. This is the largest drop in monthly growth since March 2023 and one of the largest monthly changes over the past two decades.
Chart 1: Easing core services prices drove disinflation over the last couple of months
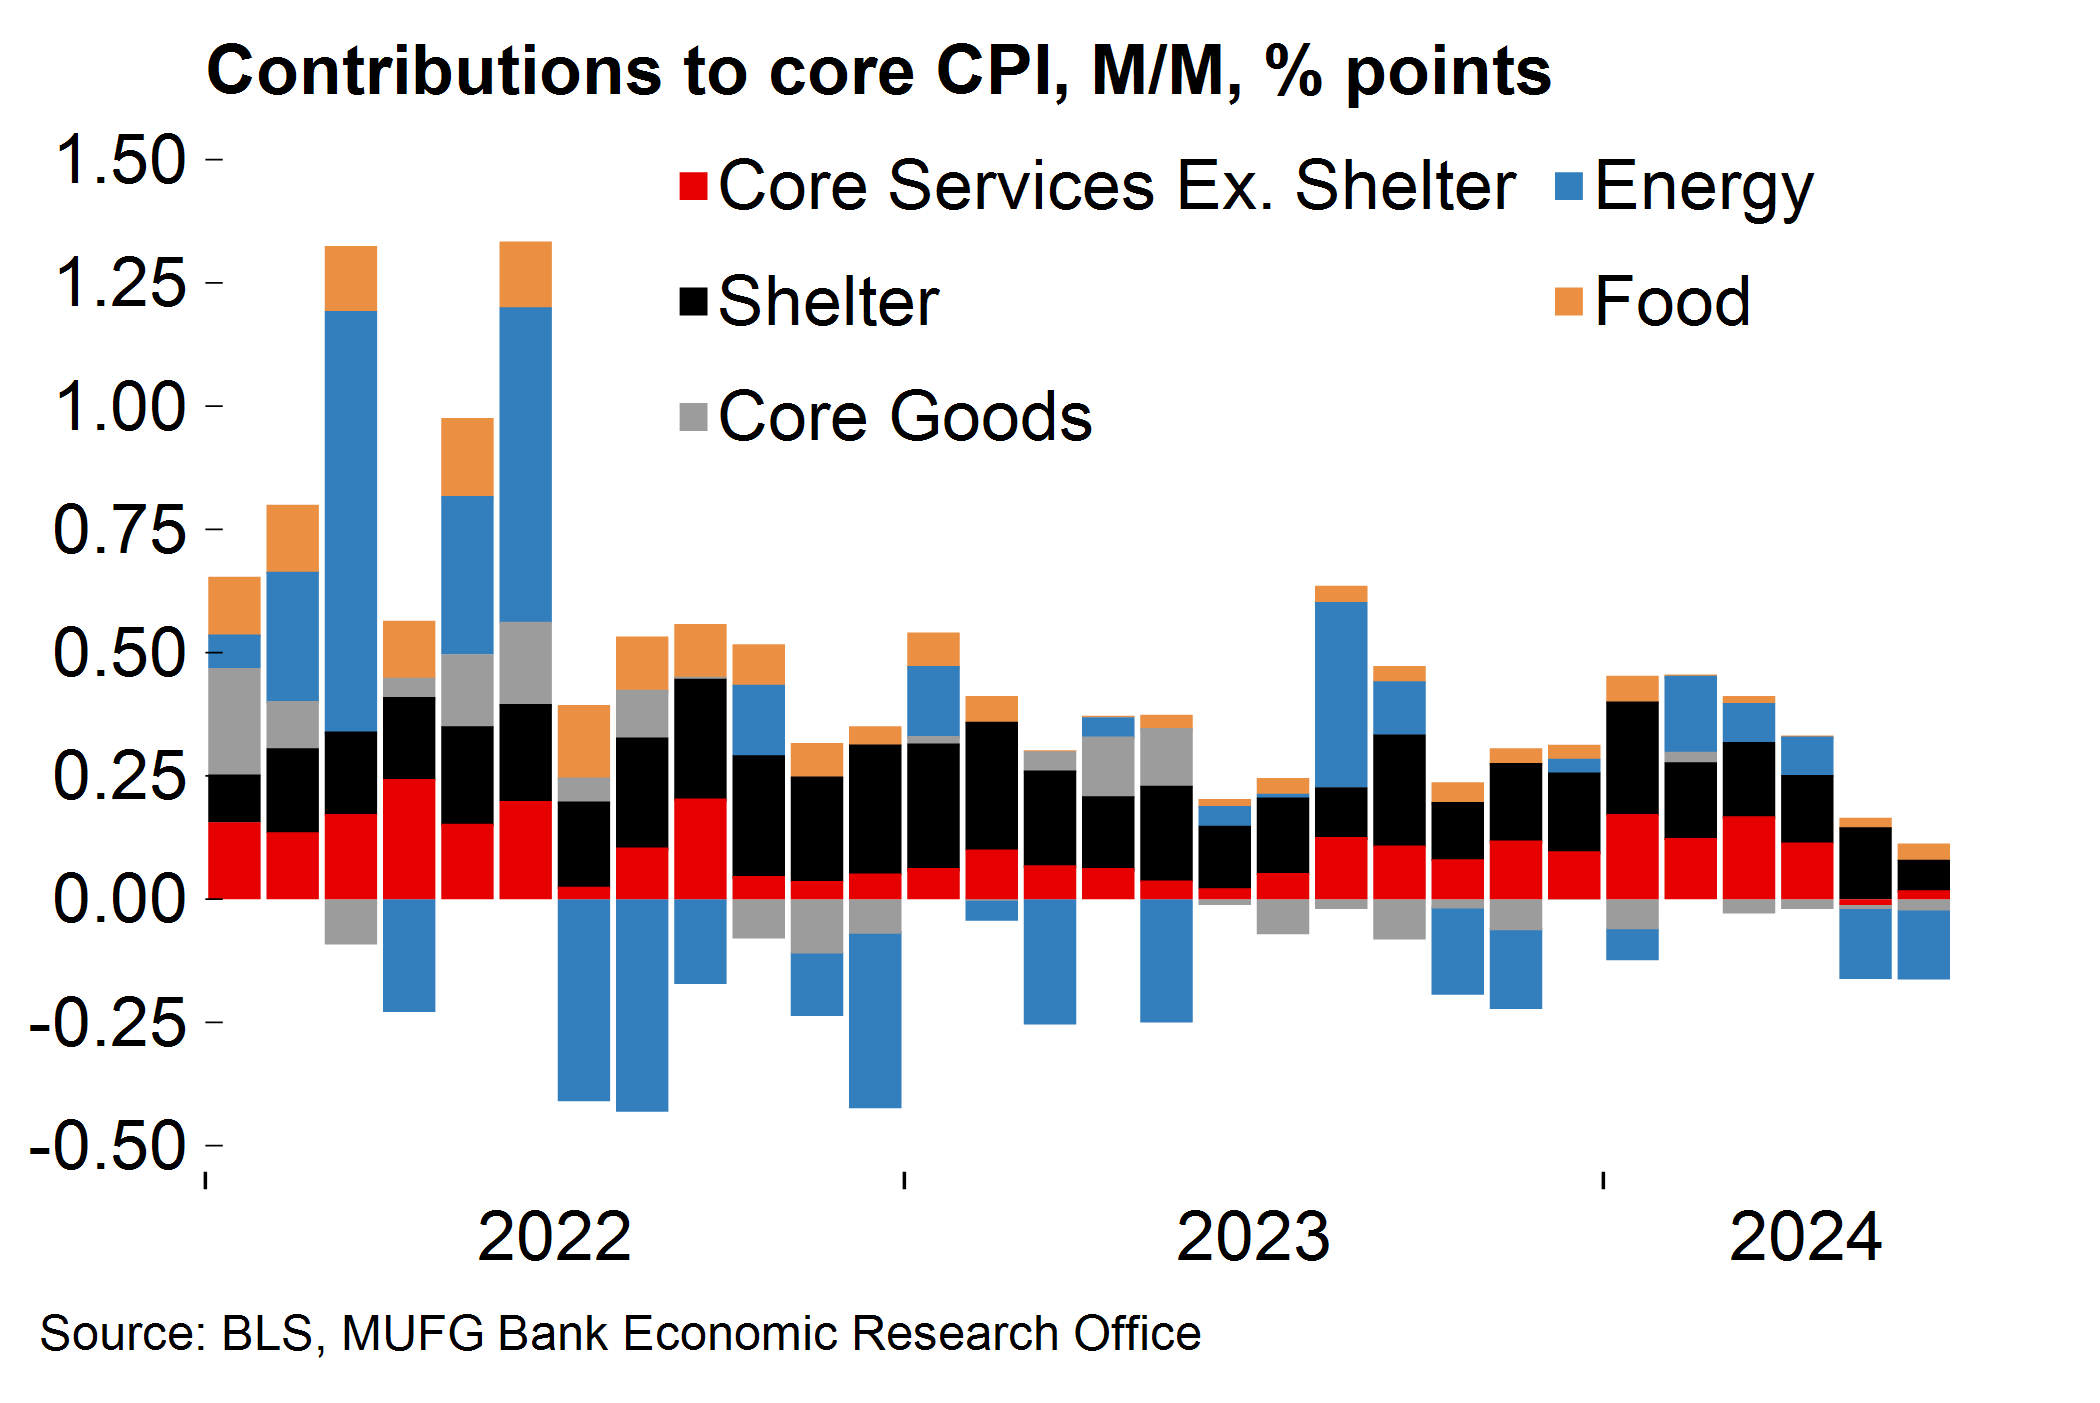
Chart 2:Shelter inflation fell dramatically in June after about a year of flat growth
The probability of a Fed rate cut to occur before Q4 this year has certainly increased, especially given the latest developments in core services and shelter prices, the most stubborn and least responsive components of consumer prices in this post-pandemic era so far.
The trend in producer prices, on the other hand, appears less favorable with monthly growth in final demand core PPI accelerating in June, and trending upward over a 3-month span (Chart 3). Even growth in personal consumption core PPI, which most closely relates to core CPI, remains elevated. However, growth is being heavily influenced by volatile wholesale and retail trade. When excluding these trade services, personal consumption core PPI is trending downward, much like consumer prices.
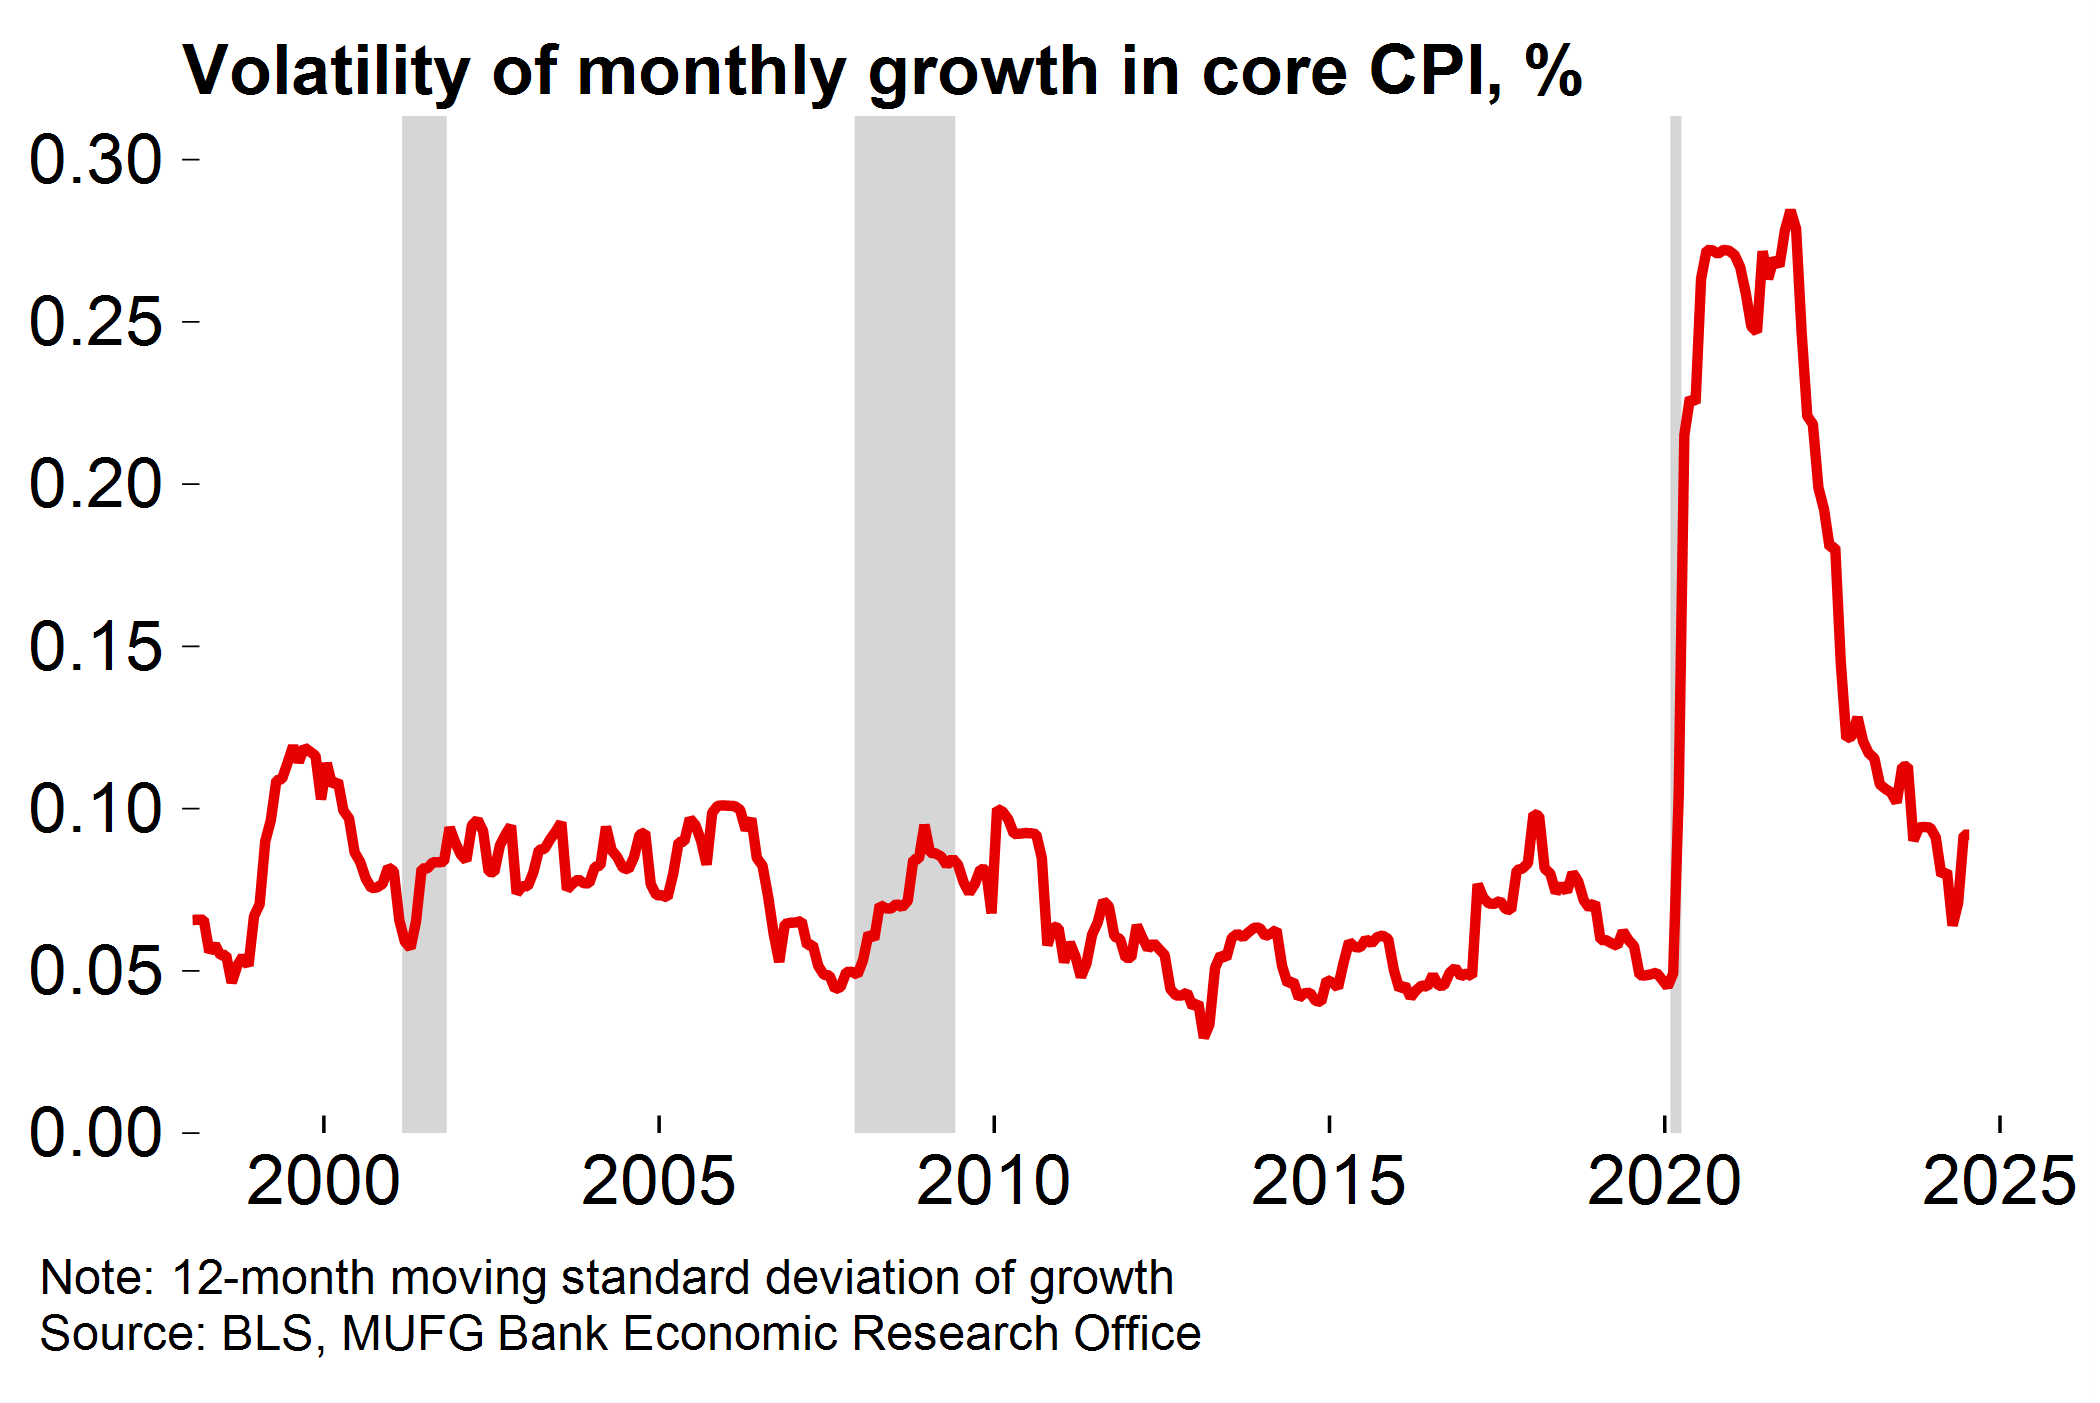
The focus should, at least partially, now shift to why inflation has suddenly eased these last couple of months, and what that means for the predictability of price growth. Easing wage growth and falling housing demand finally translating into consumer prices is one potential explanation, but research shows that wage growth has only had a small impact on non-housing services inflation over the last four years, and single-family home inventory-to-sales ratio still remains low. Volatility in core CPI (measured as the 12-month moving standard deviation of monthly growth) has increased following these latest inflation developments, and more sudden changes from month-to-month can reduce confidence in the expected trend.
Chart 3:When excluding volatile trade services, core producer prices are trending similarly with core consumer prices
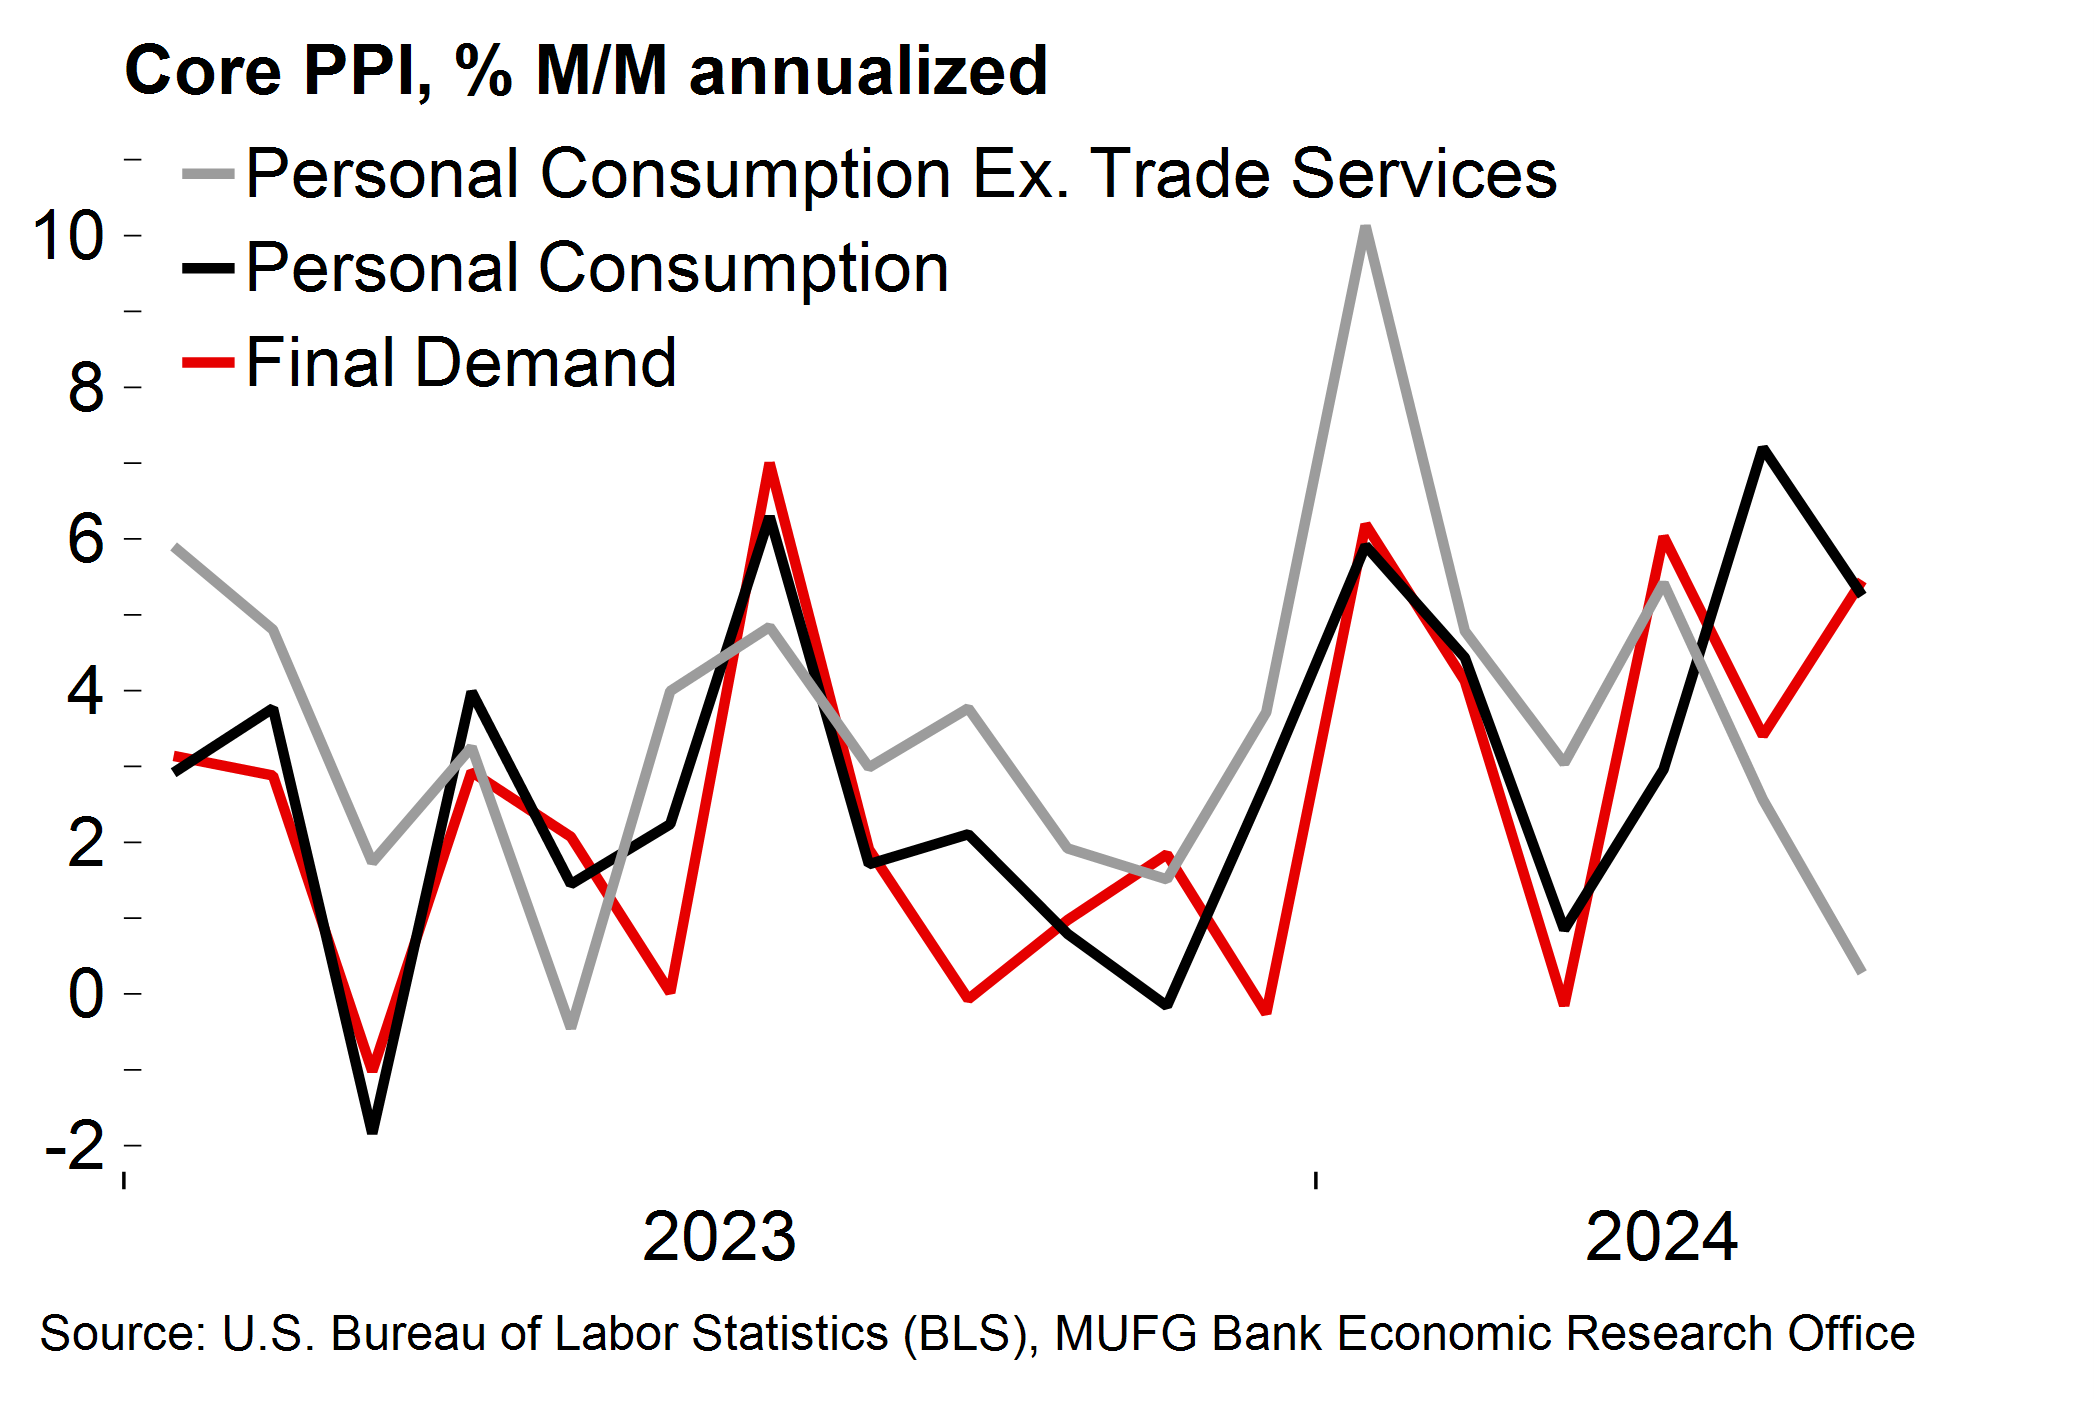
Chart 4:Volatility in monthly inflation has moved up after sudden easing in core services and shelter prices