
- Growth in unemployment, so far, has largely been a result of rising numbers of new and re-entrants to the labor force. High immigration levels have primarily driven growth in new entrants, but declining encounters along the southwest border may signal a slowdown in new workers entering the US. Additionally, strong political pressure to curb immigration may alter the trajectory of labor force growth over the next decade.
- Re-entrants to the labor force comprise a significant share of total unemployment, with growth over the past few years contributing to labor force participation rates exceeding expectations. Projections over the next decade, however, show participation rates falling across the broader labor market and even for prime-age workers.
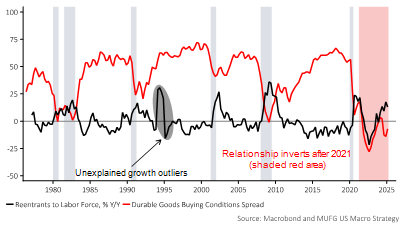
- Continued growth in re-entrants to the labor force can keep participation rates above projections, but historically that means less than favorable economic conditions. There exists a historically negative relationship between perceptions of good buying conditions and growth in re-entrants to the labor force, but there has been a dramatic reversal since 2021. This “new” relationship appears unlikely to hold, with Fed rate cuts supporting improved household financial conditions and less of a need for workers to re-join the labor force.
Immigration will likely slow
Strong immigration growth has notably altered labor market dynamics in the short-run. In 2023, the unemployment rate remained below 4% while nonfarm payrolls grew by an average of 250,000 per month. For this to occur, breakeven jobs growth (monthly job growth needed to avoid a change in the unemployment rate) would have to have risen.
Long-run breakeven employment growth is estimated to be around 70,000 to 90,000, but surging immigration and improvements in labor force participation rates over the past couple of years have significantly increased the size of the labor force, pushing short-run breakeven growth to at or above 200,000. Over the past 5 months, average monthly jobs growth has fallen below that estimate to 135,000, while 40,000 new entrants and 212,000 re-entrants were added to the labor force. A slower absorption of more workers into employment has allowed the unemployment rate to rise above 4% without a significant rise in job losses.
Immigration has been the primary source of growth in new entrants (unemployed people looking for their first job), pushing the share of foreign-born workers to 19% in Q2 2024, up from about 17.5% in 2019. This level of growth is significant by historical standards, and it has helped the Fed manage inflation by shrinking the gap between labor supply and demand, easing labor shortages and slowing nominal wage growth. Going forward, however, immigration is expected to slow, which may have implications for broader economic growth and for monetary policy.
Shown in Chart 1, the number of nationwide border encounters (including apprehensions, inadmissibles, and expulsions) has gradually fallen over the past 3 months, with most of the slowdown concentrated at the southwest border with Mexico. Attempted migration to the US may be “normalizing” toward a more sustainable level after historically high peaks from 2021 to 2023.
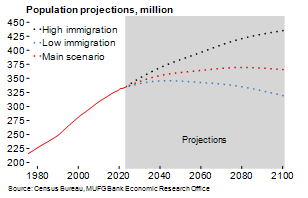
To add to it, the current political environment makes the US ripe for immigration reform. Depending on the outcome of the elections in November, there could be substantial changes made to immigration policy that would affect the trajectory of population growth in the US. Under a Republican president and Republican controlled Congress, more significant reform can be expected as it remains a leading concern among the voter base. Even under a Democratic president, there is an expectation that immigration will slow under claimed proposals, especially considering the high likelihood of a Republican controlled Senate. Projections of a high immigration scenario now appear less likely than they did at the beginning of this year (Chart 2).
Chart 1: Southwest border encounters have fallen sharply since the start of summer
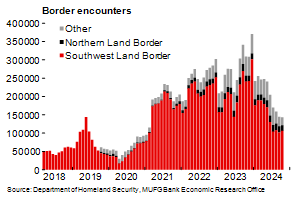
Chart 2: Recent immigration trends and political pressures make the high immigration scenario less likely
Re-entrants drove participation rates higher
Labor supply growth was supported not only by immigration, but also by re-entrants to the labor force (unemployed people with past work experience that left the labor force for a period of time before returning) that pushed up participation rates. Re-entrants comprise a significant share of total unemployment, and if growth can be sustained at its current rate, it can help offset some of the negative effects of slower immigration.
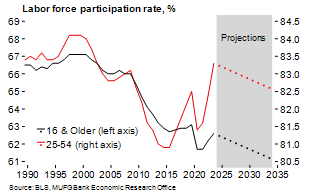
Shown in Chart 4, labor force participation rates have been trending downward for the broader labor force (16 & older) over the past 20 years. Projections from the BLS show a continued decline, with demographic forces being the major driver. The participation rate of older workers (55 & older) is considerably lower than other workers (less than 40% compared to over 80% for workers 25-54), and with America’s largest generations by population aging out of the workforce, we can expect a continued decline.
Strong immigration growth can certainly alter this demographic trend, but with uncertainty clouding future policy, the focus should be on the prime-age workforce (25-54) where labor force participation rates have been exceeding expectations. Since January 2023, the prime-age participation rate has risen by 1.2 percentage points, a significant and largely unexpected increase given how pessimistic longer-run projections are. The latest BLS projections show the prime-age labor force participation rate falling by nearly 1 percentage point over the next 10 years (Chart 4), little change from annual projections made last year.
Most of this unexpected improvement can be attributed to growth in re-entrants to the labor force. The share of re-entrants has fully recovered to pre-pandemic levels and the growth in level continues to trend upward toward rates typically only experienced during recessions (Chart 3). Immigration certainly played some role in increasing participation rates overall, but the rate of native workers is almost 4 percentage points higher than foreign-born workers in the 25-54 age group. The question now becomes why are workers returning to the labor force at such a strong rate, and can growth continue amid an uncertain future of domestic and monetary policy?
Chart 3: Re-entrants make up a substantial share of the total unemployment level
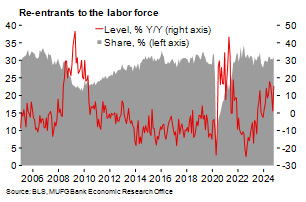
Chart 4: Continued growth in labor force re-entrants can keep participation rates higher than current long-run projections
Perceived buying conditions and labor supply growth
Maintaining growth in the labor force has strong implications for monetary policy. Slower growth in the labor force can expand the gap between labor supply and demand, increasing the severity of labor shortages and applying upward wage pressures. If sustained for long enough without parallel productivity gains, the upward pressure on prices increases.
Though the Fed has no control over immigration, monetary policy does directly influence and react to economic conditions that impact workers’ willingness to return to the labor force. Historically, poor economic conditions, and more specifically, negative consumer perceptions of buying conditions correlates with growth in re-entrants to the labor force. Shown in Chart 5, there exists a negative relationship between annual growth in re-entrants and the spread between perceived buying conditions of large household durable goods.
Chart 5: There exists a negative relationship between perceptions of good buying conditions for large household durables and workers re-entering the labor force
The University of Michigan Survey of Consumers measures perceived buying conditions for large household durables, where respondents assess whether it is a good time to buy, a bad time to buy, or an uncertain time. The percentage reporting good time to buy minus the percentage reporting bad time to buy equals the spread. From 1976 to 2020, this relationship between buying conditions and re-entrants was negative and statistically significant, where for every percentage point increase in the buying conditions spread, there was an expected average decrease of 0.32 percent points in growth rate of re-entrants (Chart 6).
Chart 6: The relationship between perceived buying conditions and re-entrants is negative and statistically significant
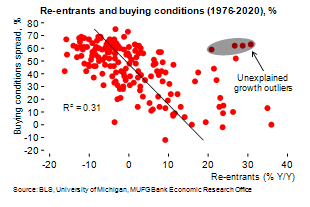
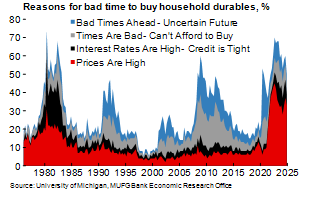
Chart 7: Elevated prices is the leading reason why respondents report buying conditions to be bad
From this perspective, you can broadly conclude that when consumers perceive the economy as being in bad shape, workers are more inclined to re-join the labor force. Intuitively, this relationship makes sense. Degrading household finances can contribute to bad perceptions of buying conditions and it can drive consumers to the labor market where they can increase their incomes. This interpretation has serious implications because it would mean that the economy needs to weaken for labor supply to grow outside of immigration.
The main caveat is that other factors were not controlled for, including any changes to domestic and foreign policy or industry specific factors. Additionally, the historical negative relationship completely reversed after 2021, where improving economic perceptions now coincides with growth in re-entrants (Chart 5). It’s not entirely clear why this relationship reversed, but much of the economic pessimism looks to be due to elevated inflation, or more specifically, perceived price levels. Shown in Chart 7, high prices is the most prominent reason that respondents reported buying conditions of large household durables to be bad, despite the relative health of US economy.
As for how this will impact the labor market, it all depends on whether this current relationship holds. Optimism around buying conditions will likely further improve as inflation continues to cool, and credit will be less of a factor now that the Fed’s rate cutting cycle has begun. But all of this appears unlikely to drive continued growth in ren-entrants to the labor force. The historical relationship between perceived buying conditions and re-entrants will likely re-emerge.
Historically, the perception of “times are bad” contributed to a significant amount of buyer pessimism (Chart 7). Deteriorating household finances is likely a major factor even in today’s environment, and elevated inflation may have distorted signals this survey might otherwise deliver. At the moment, re-entrants are joining the labor force at a rate that is historically consistent with a recession. If indeed the signals are distorted from inflation, then growth in re-entrants to the labor force will slow through 2025 as the Fed continues to cut rates and household finances improve. The outlook on labor supply growth overall looks relatively bleak.